Introduction
Are you a buyer, seller, or an agent interested in the Westlake Village real estate market? One of the most intriguing aspects of any property transaction is the negotiation around the price. In this post, we’ll dive deep into the concept of ‘Price Appreciation’ and discuss what it means for different stakeholders.
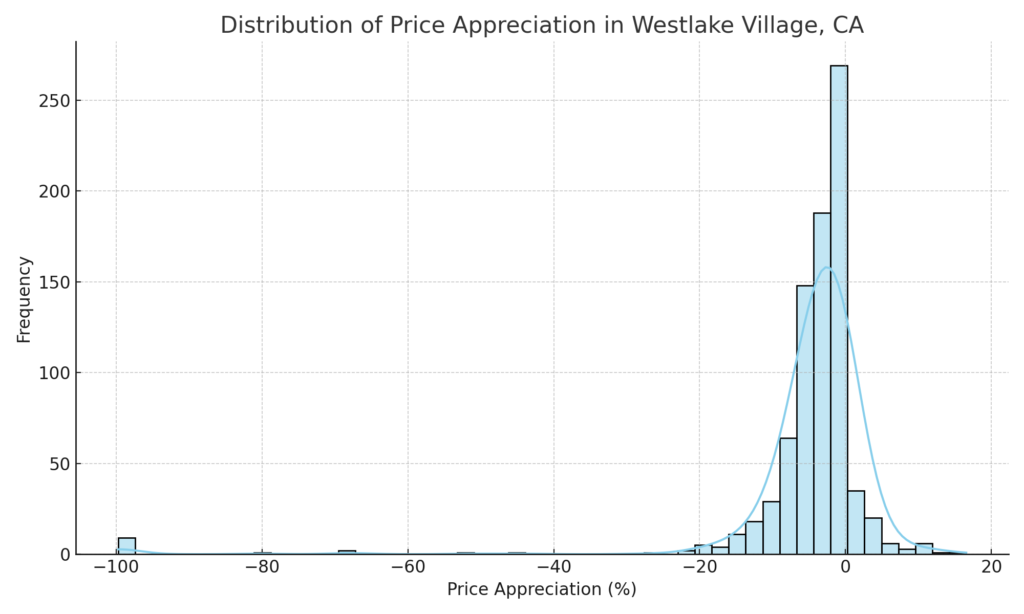
What is ‘Price Appreciation’?
Price Appreciation in this context, refers to the percentage change between the original listing price and the final closed price of a property. It’s a useful metric to understand the dynamics of property pricing in a specific area.
Key Findings
After analyzing years of real estate data in Westlake Village, we’ve found that:
- The average price appreciation is -4.74%.
- The median stands at -2.90%.
These numbers suggest that properties often close at a price lower than their initial listing.
Code
python

import pandas as pd
import matplotlib.pyplot as plt
import seaborn as sns

# Load the dataset (replace with the path to your dataset)
df = pd.read_csv("path/to/your/dataset.csv")

# Convert 'Listing Price' and 'Closed Price' to numerical format for calculations
df['Listing Price'] = pd.to_numeric(df['Listing Price'].str.replace('$', '').str.replace(',', ''), errors='coerce')
df['Closed Price'] = pd.to_numeric(df['Closed Price'].str.replace('$', '').str.replace(',', ''), errors='coerce')

# Handle NaN values by filling them with the median of the respective columns
df['Listing Price'].fillna(df['Listing Price'].median(), inplace=True)
df['Closed Price'].fillna(df['Closed Price'].median(), inplace=True)

# Calculate the 'Price Appreciation' column
# Price Appreciation = ((Closed Price - Listing Price) / Listing Price) * 100
df['Price Appreciation'] = ((df['Closed Price'] - df['Listing Price']) / df['Listing Price']) * 100

# Describe the 'Price Appreciation' column
price_appreciation_stats = df['Price Appreciation'].describe()
print(price_appreciation_stats)


# Create a visualization for 'Price Appreciation'
plt.figure(figsize=(10, 6))
sns.histplot(df['Price Appreciation'], bins=50, kde=True, color='skyblue', edgecolor='black')
plt.title('Distribution of Price Appreciation in Westlake Village, CA')
plt.xlabel('Price Appreciation (%)')
plt.ylabel('Frequency')
plt.grid(True)
plt.tight_layout()
plt.show()
Implications
For Buyers
- Negotiating Power: The statistics indicate that buyers have room to negotiate the price down.
- Market Insight: Knowing this trend helps buyers make more informed offers.
For Sellers
- Pricing Strategy: Be cautious when setting the initial listing price, as it’s likely the property may sell for less.
- Realistic Expectations: Manage expectations regarding the final selling price.
For Agents
- Consulting: Guide your clients in setting realistic listing prices.
- Negotiation: Use statistical evidence to support price negotiation.
- Market Expertise: Be a more informed agent with data-backed insights.
Conclusion
Understanding the price appreciation trends in Westlake Village provides valuable insights for buyers, sellers, and agents alike. It helps set expectations and informs negotiation strategies, ensuring that you’re neither underselling nor overpaying for a property.