Introduction
Determining the growth rate for real estate properties is crucial for buyers, sellers, and investors alike. In this blog post, we explore how to accurately estimate the growth rate for properties in Westlake Village, CA. After comprehensive analysis, we conclude that the Compound Annual Growth Rate (CAGR) for most properties likely falls between 4.58% and 6.03%.
Methodology
Data Source
We started with a dataset of 274 waterfront property listings from Westlake Village, CA, spanning from the year 2000 to 2023. The dataset includes various attributes such as the property address, closed price, list price, and others.
Data Cleaning
The first step was to clean the data, converting price columns to numerical formats and handling missing values to ensure accurate analysis.
Calculating the Growth Rate
We calculated the growth rate using two methods:
- Direct CAGR Calculation: This method used the average closed prices for the earliest and latest years available in our dataset.
CAGR=(Final ValueInitial Value)1Number of Years−1CAGR=(Initial ValueFinal Value)Number of Years1−1
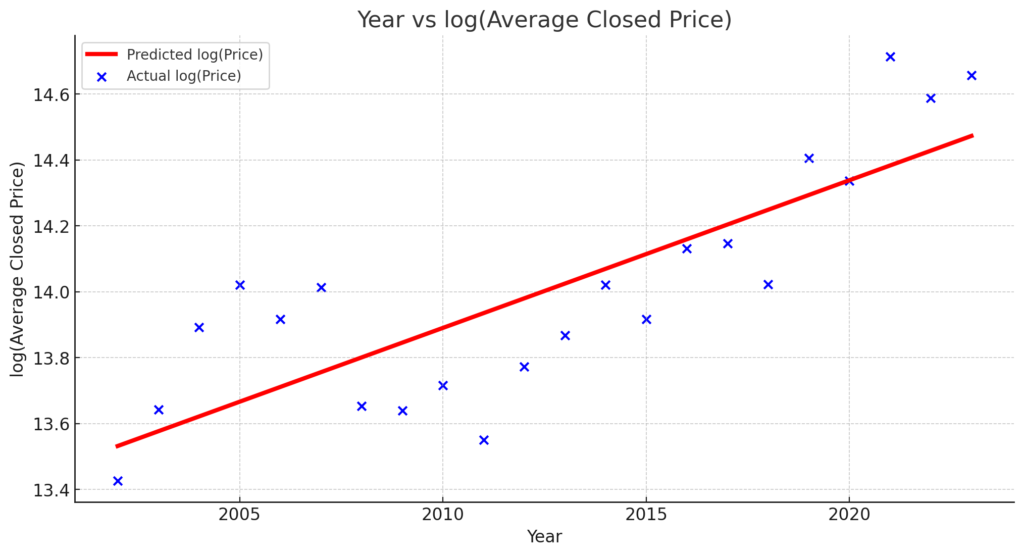
- Linear Regression Model: This method involved fitting a linear regression model to the log-transformed average closed prices for each year.
python

import pandas as pd
import numpy as np
from sklearn.linear_model import LinearRegression
import matplotlib.pyplot as plt

# Load the dataset (replace with the path to your dataset)
df = pd.read_csv("path/to/yourdata.csv")

# Data Cleaning
df['Price'] = pd.to_numeric(df['Price'].str.replace('$', '').str.replace(',', ''), errors='coerce')
df['Closed Price'] = pd.to_numeric(df['Closed Price'].str.replace('$', '').str.replace(',', ''), errors='coerce')
df['Closed Date'] = pd.to_datetime(df['Closed Date'], errors='coerce')
df['Approx SqFt'] = pd.to_numeric(df['Approx SqFt'].str.replace(',', ''), errors='coerce')
df.dropna(subset=['Price', 'Closed Price', 'Closed Date', 'Approx SqFt'], inplace=True)

# Extract the year from 'Closed Date'
df['Closed Year'] = df['Closed Date'].dt.year

# Direct CAGR Calculation
initial_value = df.groupby('Closed Year')['Closed Price'].mean().iloc[0]
final_value = df.groupby('Closed Year')['Closed Price'].mean().iloc[-1]
number_of_years = df['Closed Year'].max() - df['Closed Year'].min()
cagr_direct = ((final_value / initial_value) ** (1 / number_of_years)) - 1

# Linear Regression Model Growth Rate
X = df.groupby('Closed Year')['Closed Price'].mean().reset_index()['Closed Year'].values.reshape(-1, 1)
y = np.log(df.groupby('Closed Year')['Closed Price'].mean().values)  # We take the log to linearize the problem
model = LinearRegression()
model.fit(X, y)
cagr_lr = np.exp(model.coef_[0]) - 1

print(f"Direct CAGR Calculation: {cagr_direct * 100:.2f}%")
print(f"Linear Regression Model Growth Rate: {cagr_lr * 100:.2f}%")

# Optional: Plotting for visualization
plt.scatter(X, y, color='blue', label='Actual log(Price)')
plt.plot(X, model.predict(X), color='red', linewidth=3, label='Predicted log(Price)')
plt.xlabel('Year')
plt.ylabel('log(Average Closed Price)')
plt.title('Year vs log(Average Closed Price)')
plt.legend()
plt.grid(True)
plt.show()
Both methods have their pros and cons. The direct calculation assumes a constant growth rate over the years, while the linear regression model captures yearly fluctuations better.
Findings
CAGR Rates
- Direct CAGR Calculation: 6.03%
- Linear Regression Model: 4.58%
Examples
We selected two properties to illustrate how these rates would impact their future and past values:
Example 1:
- Closed Price: $1,610,000
- Future Value using 6.03% CAGR: $2,157,785 (approx)
- Future Value using 4.58% CAGR: $2,014,278 (approx)
- Actual Average Past Price in Similar Properties: $959,067
Example 2:
- Closed Price: $2,500,000
- Future Value using 6.03% CAGR: $3,350,598 (approx)
- Future Value using 4.58% CAGR: $3,127,760 (approx)
- Actual Average Past Price in Similar Properties: $767,730
Validation
We compared the past values calculated using both CAGR rates with the actual average closed prices of similar properties from 5 years ago. The calculated past values were closer to the actual past prices, suggesting that both rates have some validity.
Conclusion
After rigorous analysis, we believe that the growth rate for most properties in Westlake Village, CA, lies between 4.58% and 6.03%. While both methods provided valuable insights, it’s likely that the true growth rate is somewhere between these two figures. This range provides a useful guideline for anyone interested in the real estate market in Westlake Village.
By considering multiple methods and validating against past data, we’ve arrived at a more nuanced and reliable estimate of the property growth rate in this area.